Data Visualisation
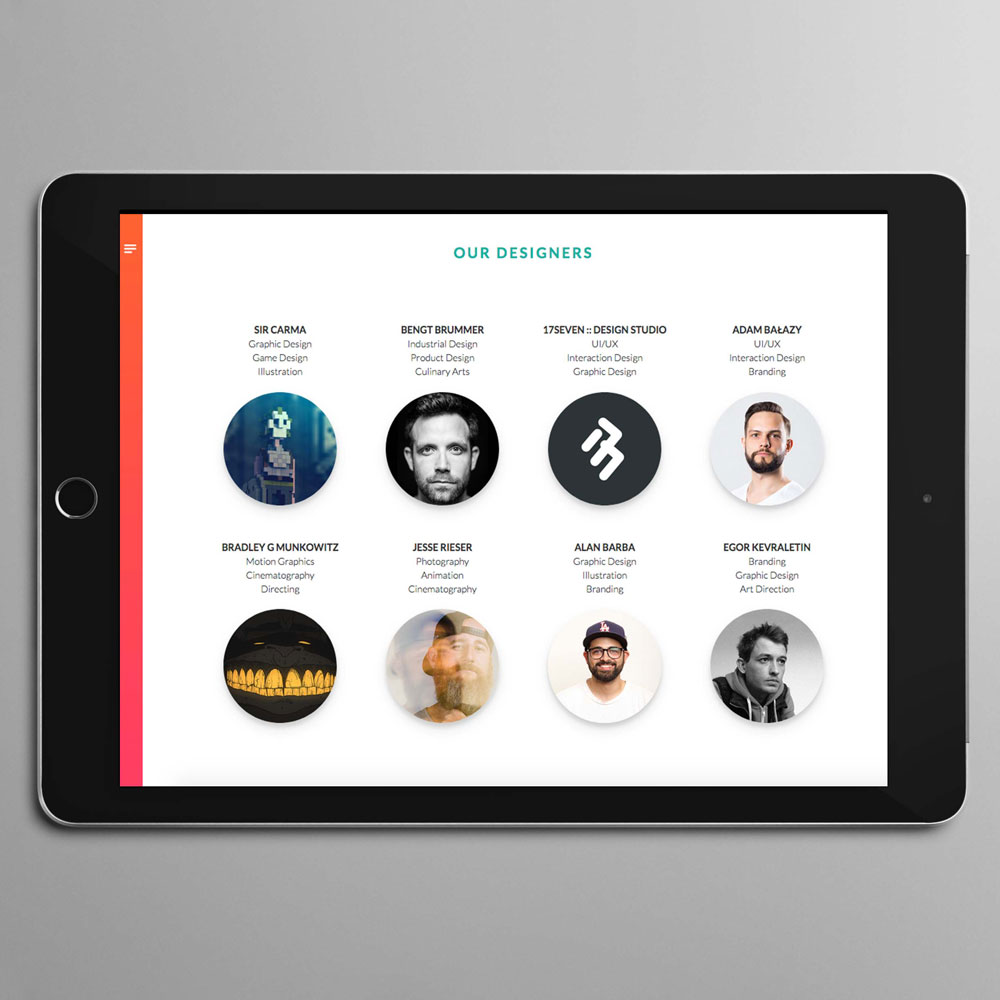
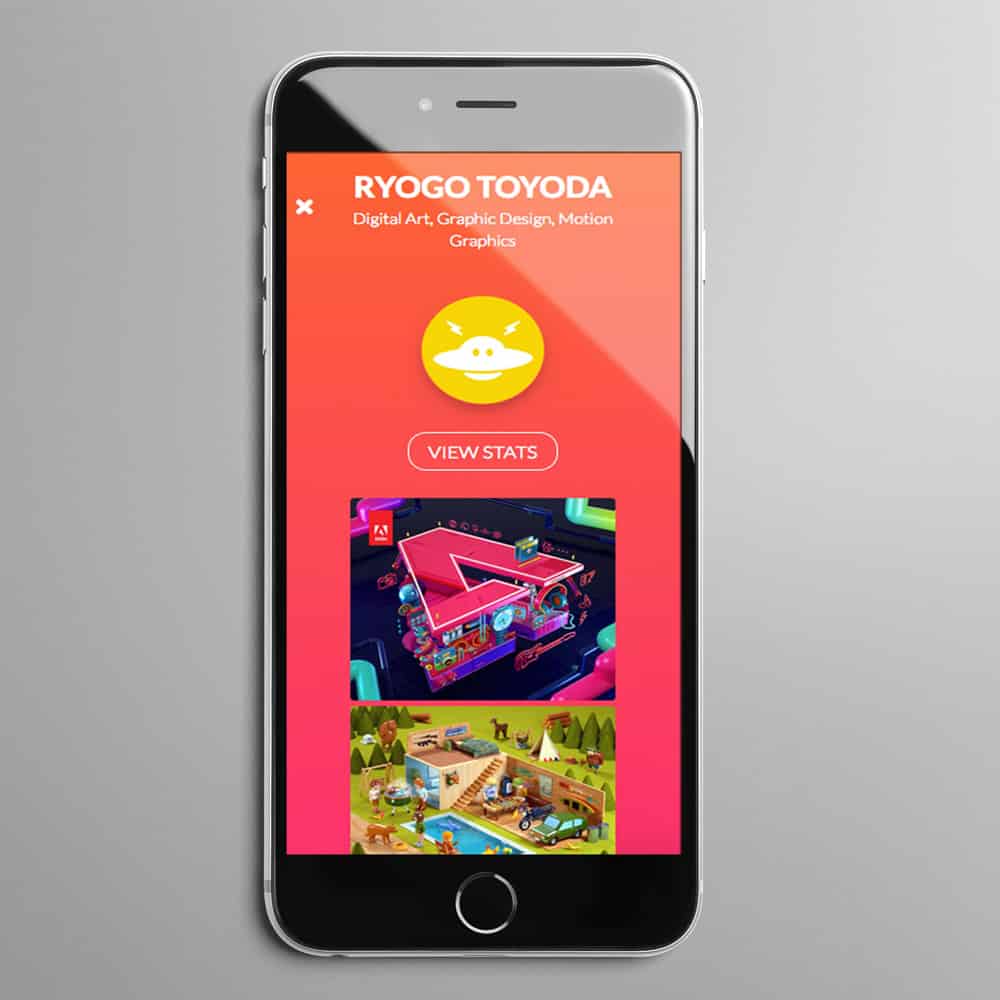
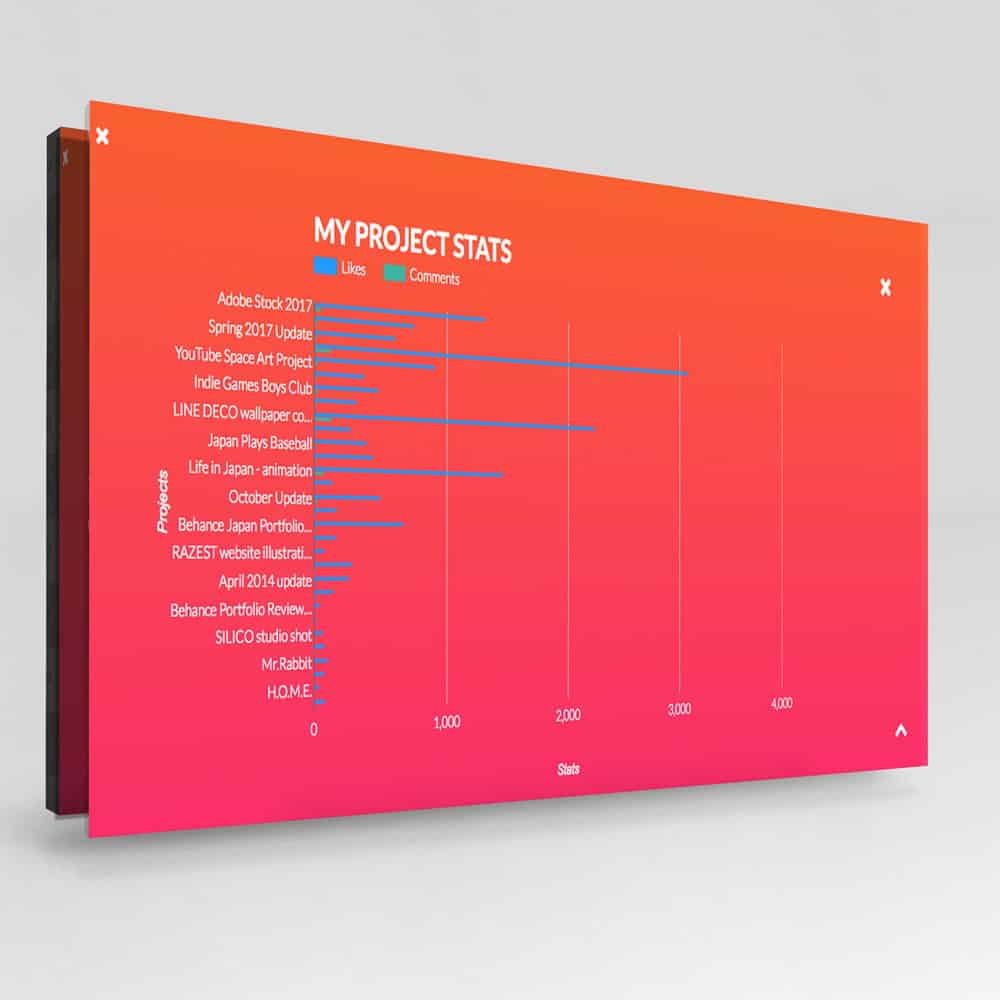
The brief was to create a single page web application that pulled data from the Behance API to show off designers work. Users are able to view designers projects and statistics about their projects such as likes, views and comments in the form of a visualisation, which was created using the Google Charts API. This was a group project completed during my time at Yoobee School of Design.
Objectives
- To provide a platform for designers to show off their work in the form of a visualisation
- Enable users to engage in a visual representation of designers work
- Effective collaboration to achieve deadlines
Key responsibilities
- Fully responsive for mobile, tablet and desktop
- Use multiple APIs to pull data
- Use JavaScript to manipulate the DOM
- Collaborated clean code to a GitHub repository


